Project 3!!! (and don't forget the Infographic)
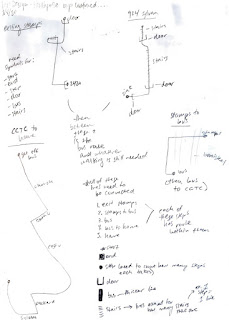
I am really looking forward to working on this project even though there is a short timeline! When I first started collecting data this past week, the first thing I thought of was the Giorgia Lupi lecture we watched at the beginning of the semester and the postcard project she did with her friend for a year. I have been using my gratitude journal since around the halfway point of this semester and decided to use everything I have recorded in it thus far leaving me with a lot of data to go through. Though it is exciting to look back and see what I have written about because, like the goal of this project, it brings me joy and also reminds me of what happened on each day. During Monday’s class I began tagging each “piece of joy” with the values that Hannah shared with us. Some had around three to five tags while some had only one so it depends. The images below show me working through all of this data as I outlined each tag in sections. I then tallied them all up and my top four values were 1) enjoyment, 2) relationships, 3) security, and 4) responsibility.
Once I knew this information my next goal was to think about how I can represent this in a way that would be visible and accessible to me for the future. I realized that I love collecting books, journals, and basically anything made with bound paper. I thought representing this data in a sort of booklet or zine format would be useful to me as I like to keep a lot of my books and journals that I’m currently going through on my bedside table and this would be a perfect addition. Then I started thinking about how to represent this data and went back to the Giorgia Lupi inspiration. I decided that each of my four main tags would have a page in the book. On that page I would show each individual thing that brought me joy through some sort of symbol. I really like the idea of having this book seem like nonsense to anyone else trying to read it but having it act as a kind of memento to me because I will be the only one who is able to read it. I realized I also do have a lot of repeat items from day to day and by giving each of these a symbol I can see which items have repeated the most throughout the four main tags.
This is my plan for this project only though in our small group discussions on Wednesday, I realized this format also allows for a lot of growth and continuation in the future. I think I would like to keep this project going in the future and continue collecting and representing data in this way. I think this could be an interesting exploration to continue for a year or so. I still intend to fill out my gratitude journal after this project is over so I can keep using it not only as a therapeutic exercise but a vehicle to collect data. I am thinking that each semester I continue this I can make a new booklet and start a collection based on the different times of my life. It can almost be a collectible set of some sorts. I’m really excited about continuing to work on this!
(I will also use this weekend to keep working on my infographic- haven’t touched it since before break, whoops)


Comments
Post a Comment