Posts

Showing posts from December, 2020

Project 3 Plans + How it Relates to My Infographic
Image
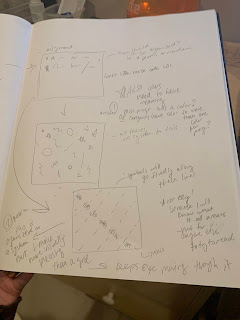
   So I’m steadily continuing work on the joy booklet. I LOVE this project and not only do I enjoy designing this but it has allowed for a great reflection. I love looking back at what I’ve written so far and this is a great excuse to do so. I haven’t done a ton more work since last week as I have been trying to finish all the finals stuff that’s going on right now. BUT the sketch below shows what I’ve been thinking about so far. I have a solid plan, I was just trying to visualize it. I wanted to come up with some sort of axis or path for my icons to follow as it will sort of be a “visual gratitude journal” as Hannah put it which I think is a great way to describe it.  I came up with this sort of diagonal axis by day to place my icons along and I still like this idea but I think it needs to happen more organically on the page. Once I come up with my icons I’m going to start sketching them and see what works best from there. This goes back to how I need to just let the data guide ME ins
Project 3!!! (and don't forget the Infographic)

Image
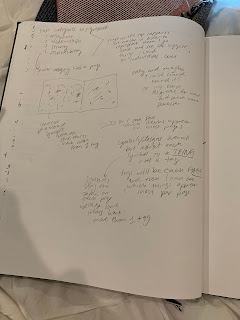
I am really looking forward to working on this project even though there is a short timeline! When I first started collecting data this past week, the first thing I thought of was the Giorgia Lupi lecture we watched at the beginning of the semester and the postcard project she did with her friend for a year. I have been using my gratitude journal since around the halfway point of this semester and decided to use everything I have recorded in it thus far leaving me with a lot of data to go through. Though it is exciting to look back and see what I have written about because, like the goal of this project, it brings me joy and also reminds me of what happened on each day. During Monday’s class I began tagging each “piece of joy” with the values that Hannah shared with us. Some had around three to five tags while some had only one so it depends. The images below show me working through all of this data as I outlined each tag in sections. I then tallied them all up and my top four values w